
- Digital Marketing
How to Use Google Analytics - The Basics
We’re going to start this post by answering a philosophical question which has been argued and debated across generations and has eluded some of the sharpest minds ever to have existed. What an intro ey?
If a tree falls in a forest does it make a sound?
Well I’m going to argue that in this particular instance, yes it does.
Now I must say ‘in this particular instance’ does relate to something very specific so I won’t quite be claiming any credit for solving metaphysical puzzles just yet. What I really mean by this answer is that just by ignoring something or being completely unaware of an event, it doesn’t protect you from it.
In our field this certainly relates to websites, their development and how they’re managed. The truth is that a lot of time and effort is expended in the design and development of a new website but when it is launched it is often thought by the client ‘job done’. The thing about digital, and it’s one of the reasons we love it so much, is that it is constantly evolving. Processes and techniques become out of date very quickly (looking at you reader in the year 2043, no judgements on how we used to do things please) and this should be both expected and anticipated.
The trouble is business owners rarely know much about how their site is performing. In our role here managing digital marketing campaigns, I couldn’t tell you the amount of times we’ve gained a client and in looking to gain a sense of their position in the search landscape, find that although we know there is a Google Analytics account setup for the site, no-one knows the login details. It seems to be an aspect of a site build judged as initially necessary as purchasing an SSL certificate and with the same attitude of once it’s there, it’s done.
But that truly isn’t the case and in knowing your way around Google Analytics, finding and monitoring just a few key metrics will really help you make the most of your site and the money which has been invested in it.
Navigating the interface
So you log into your account and what you’re presented with is something like this…
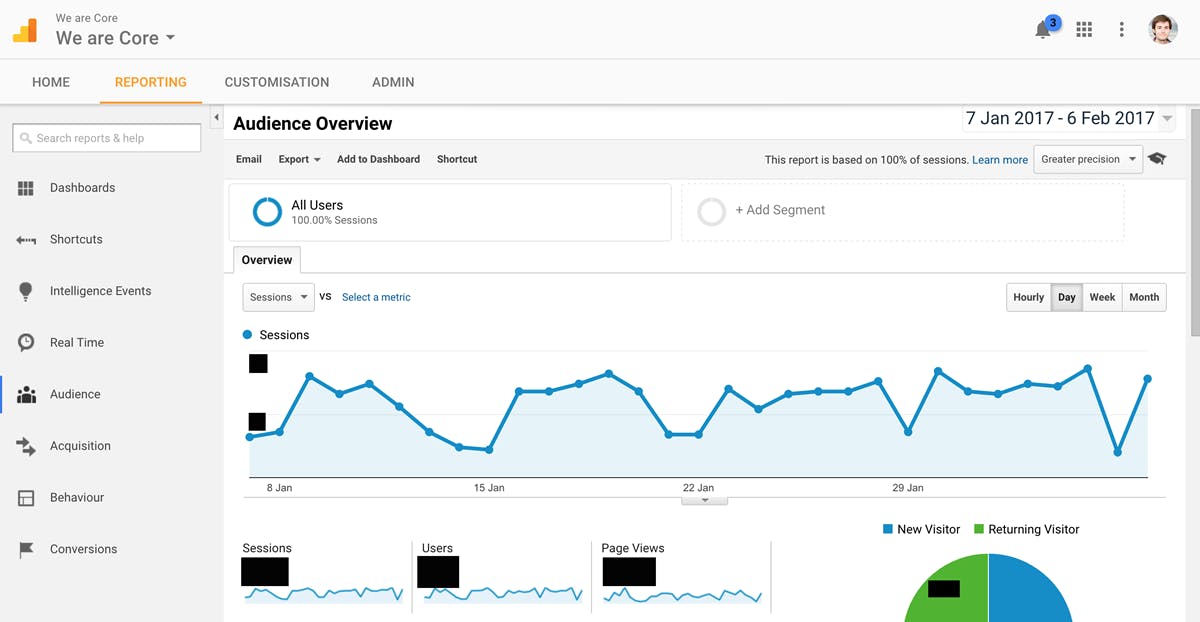
“So where do we start? Hmmm…”. I can image your internal monologue is something like this.
I do appreciate that it can seem overwhelming at first glance but with a few tips you’ll actually find it’s pretty intuitive.
Audience
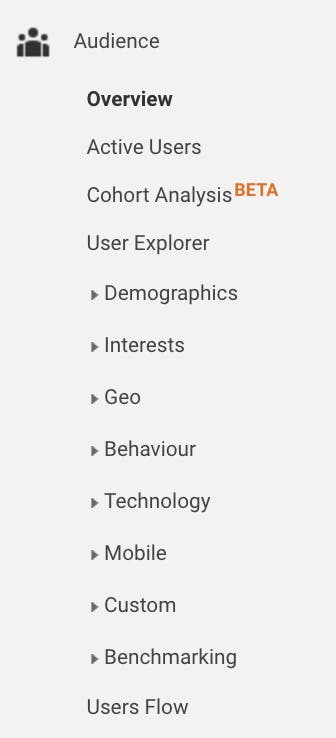
If you literally have a minute to spare and want to get a top line view of how your site is performing, the Overview section of the Audience tab is your destination. Here it will tell you how many sessions and users were recorded over a customisable time period while also giving you a snapshot of user engagement metrics (how visitors are actually behaving when on your site).
These engagement metrics are sadly undervalued in comparison to visit numbers which is often wrongly seen as the KPI. So for example you may receive an increase in traffic to your site which on the surface you see as a big win, but in reality with an additional rise in bounce rate (those visitors landing on your site and immediately leaving without engaging with your site at all), these new visitors are largely irrelevant.
In addition to these metrics you will also see various other bits of fun stuff included under the Audience tab. By switching on Demographic tracking, you can gain so much knowledge about the type of users your site is attracting e.g. age, gender, location, interests. By knowing this stuff you can understand what type of content your users are going to like and shape your site accordingly.
You can also monitor how many people are accessing your site via a mobile device under the Mobile section. This can help inform large site decisions you may want to make e.g. making your site responsive after finding that over 50% of your visitors come from mobile/tablet devices and are at the present time viewing a broken version of your site.
Acquisition
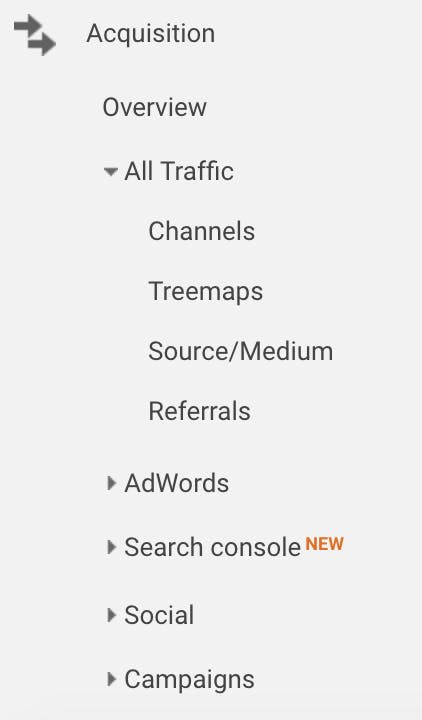
The Acquisition tab is very useful in determining how your users actually got to your site. Under the All Traffic section, traffic will be separated into silos such as:
- Direct - those entering your site address straight into the URL bar or any traffic they cannot attribute a source for
- Organic - those who arrived via a search engine
- Referral - those who clicked onto a link to your site from another website
- Paid Search - those who arrived via a form of online advertising e.g. Google Ads
- Social - those who arrived via a social media channel
- Email - those who arrived through an email marketing campaign
Each of these channels has its own data associated to it, allowing you to easily analyse performance of any campaigns you have running or prompt campaigns to be set up. For example, if you find that you have a very low percentage of visits coming from referrals, it may encourage you to start an outreach/link building campaign. This will hopefully help build a diverse visitor audience profile and reduce reliance on a single traffic stream.
Behaviour

The Behaviour tab is the place to go if you want to find out about the granular detail of site performance. This includes the popularity of site content and, perhaps more importantly, landing page content. Landing pages are vital as they are the gateways to the site for your visitors. So if you find that a good percentage of users are landing on a certain page of the website and you know it has a poor user experience (e.g. lack of content, weak navigation to key pages) you can adjust that page accordingly.
This section can also tell you about some of the more technical aspects of the site such as site speed. Sites that are slow to load, besides being incredibly frustrating for users, are unlikely to do well with Google in their rankings and so can have a real effect on organic traffic. This section can provide you with actual data to present to your web developers to get those site speed times as low as possible.
Of course, there is far more to Google Analytics than simply what is mentioned above but this will certainly go a long way in helping you gain a grasp of your site and how it performs.
It will hopefully provoke questions in your own mind and encourage a dialogue between yourself and your dev/digital marketing team in a bid to make sure your site is performing at its very best.
So in short, make sure that tree falling in the forest is heard!
For more advanced reporting features, please get in touch and we'd be happy to help find solutions.